Classify
The iris dataset is a classic machine learning and statistics dataset, consisting of 150 samples of iris flowers, each with four features: sepal length, sepal width, petal length, and petal width. The dataset is commonly used for classification tasks, where the goal is to predict the species of an iris flower based on its features. The three species in the dataset are Iris setosa, Iris versicolor, and Iris virginica. In this project, I implemented two different classifiers to classify the iris dataset: k-means clustering and a neural network. In this page, I will discuss the implementation of both classifiers and the results of various experiments conducted to evaluate their performance.
For this project, I implemented a simple kMeans solution by using a constant seed so that the random generator would still give the same results each time. Then I pick k “random” sample means, and loop through each flower and each sample and add the flowers to the closest sample mean. Once fully through, I update the sample means and repeat the loop until we reach convergence (previous means = current means).
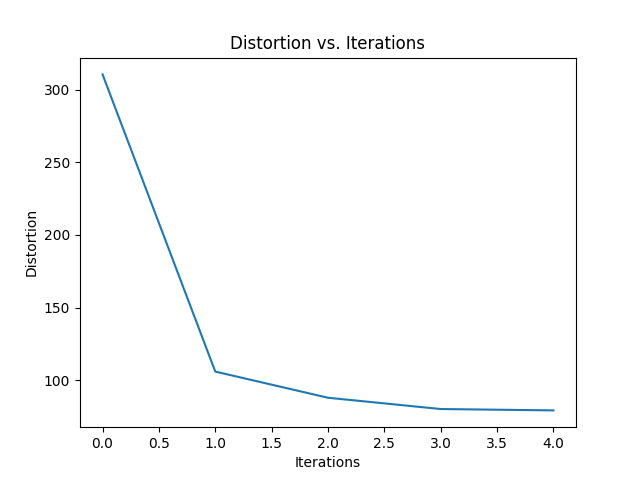
Shown is a simple graph of Distortion vs. Iterations which measures the overall distortion of all clusters measured over time.
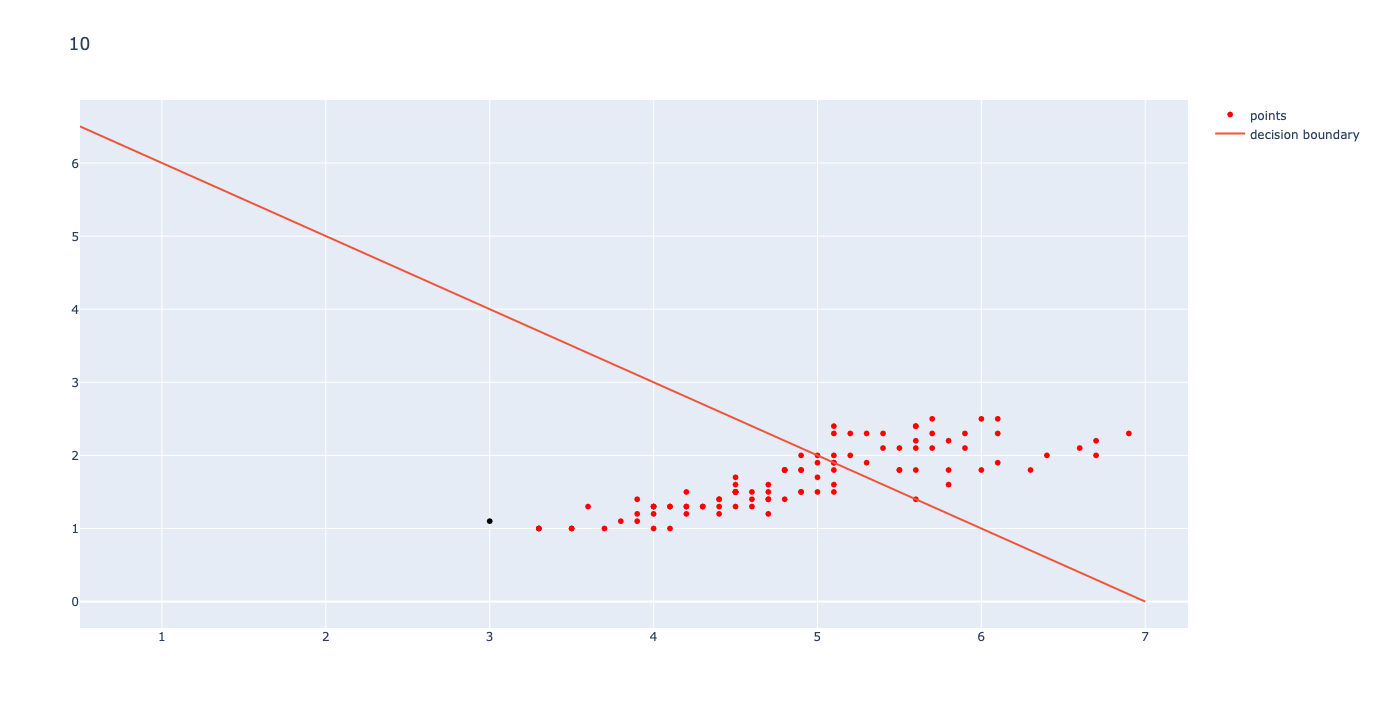
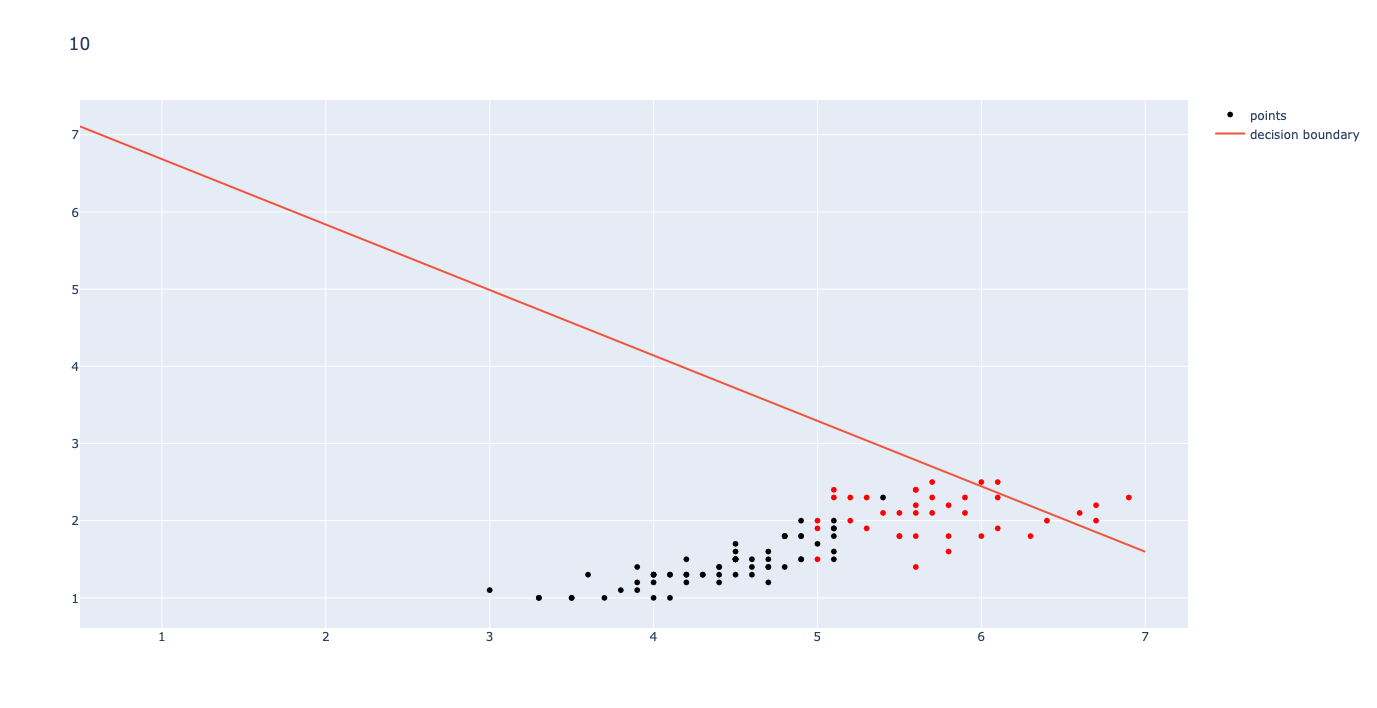
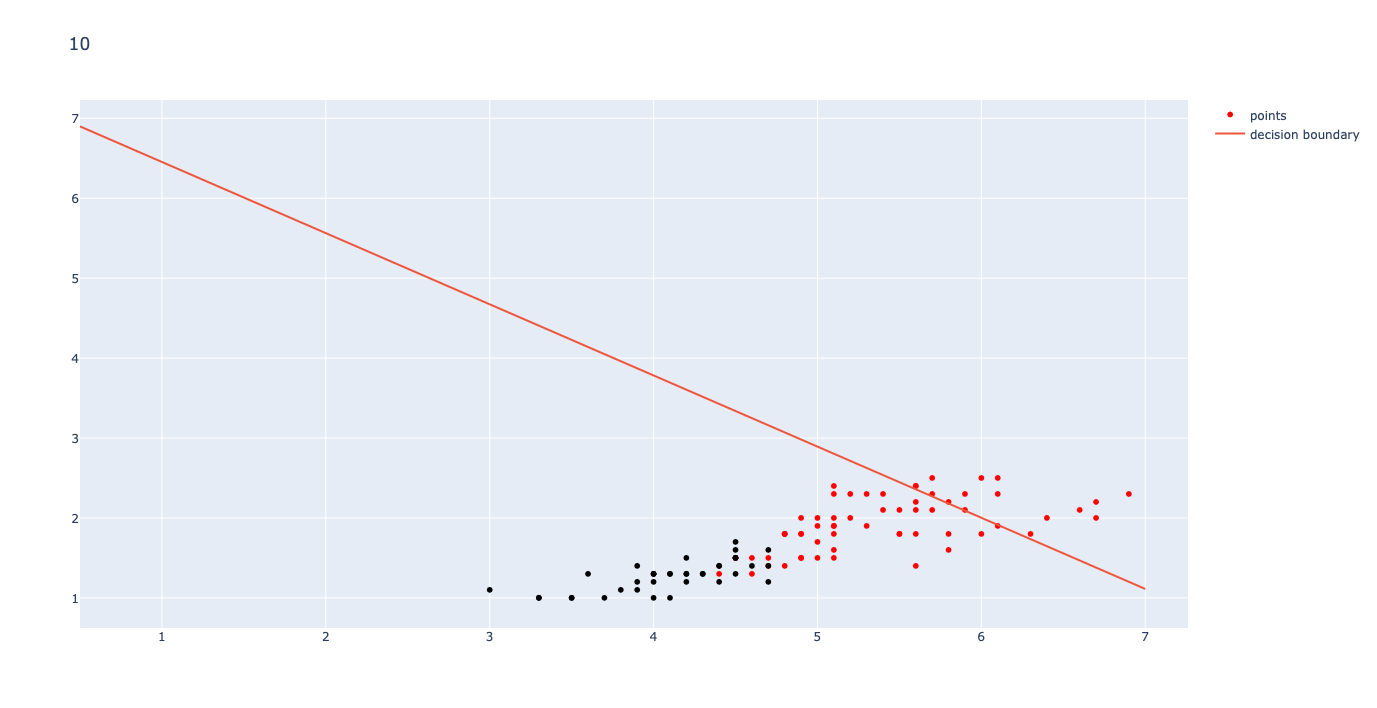
To visualize the running of K-Means clustering, I have attached below the initial means, an intermediate clustering, and the final, converged means for k=2.
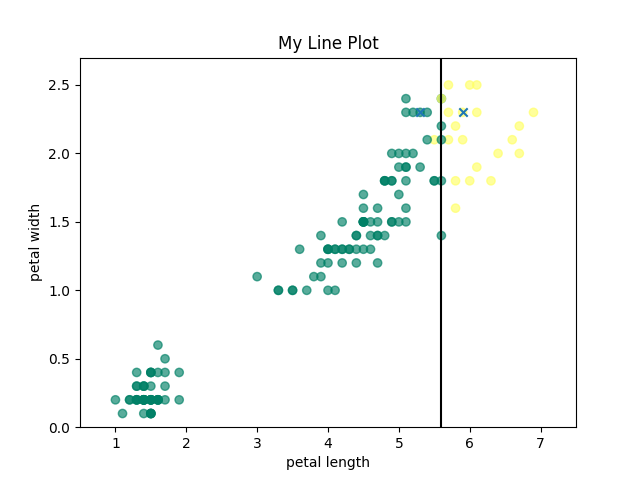
Initial Means
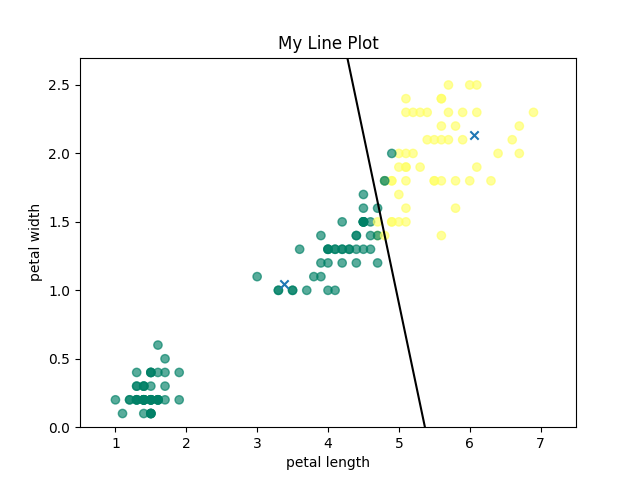
Intermediate Clustering
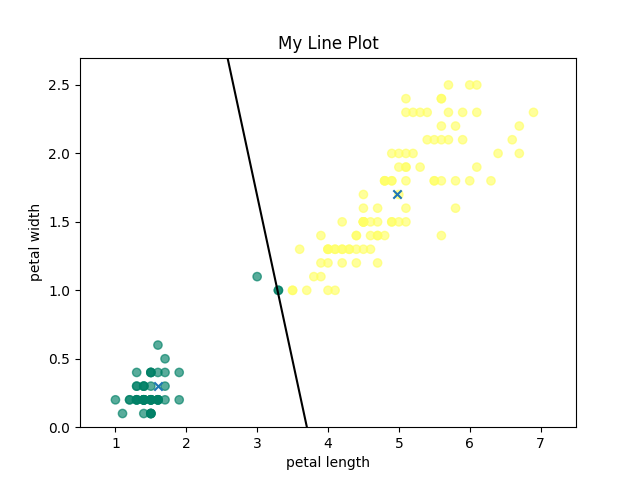
Final Converged Means
Neural Network:
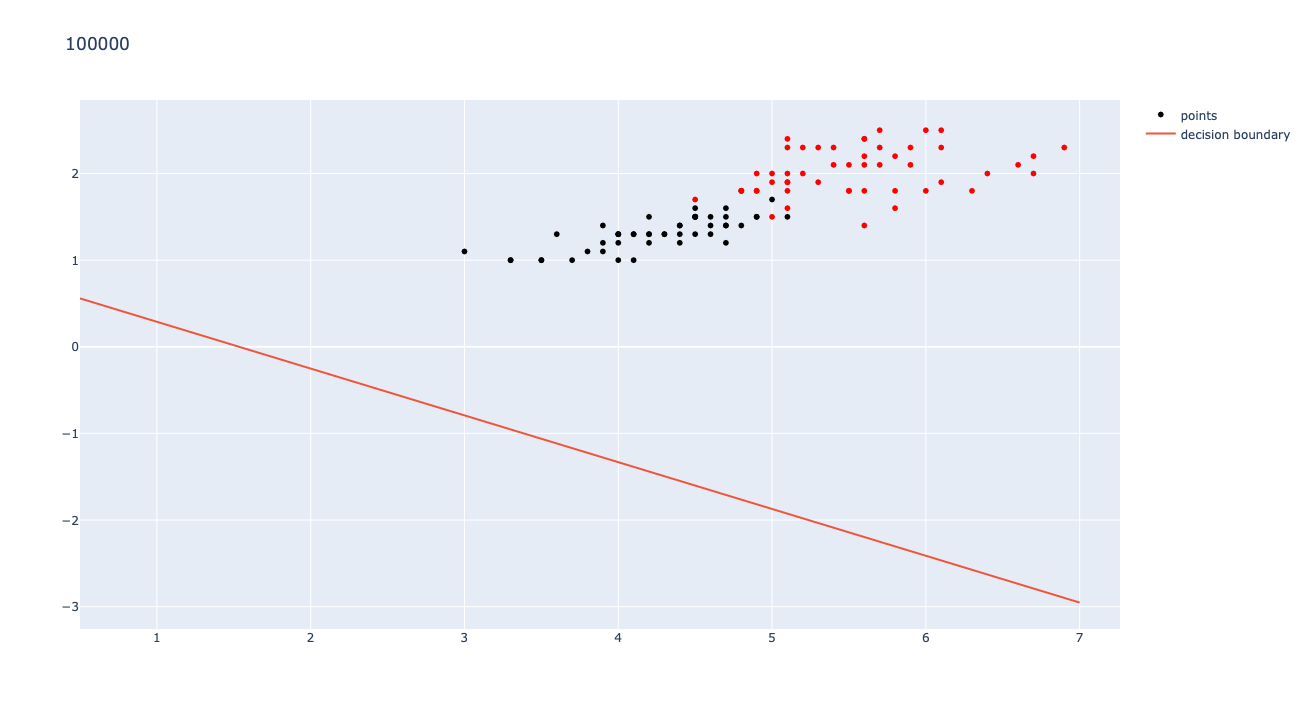
For the neural network code, I decided to change the system I used for the kMeans and instead use numpy arrays for more options and I used plotly for the graphs instead of matplotlib. To actually run the neural network, I ran MSE which calculates the mean squared error using my prediction function in combination with the sigmoid function (used as activation). Then I ran the plot_boundary function which plots a boundary line in between the two clusters (2&3). The MSE function takes in the data vectors, the parameters defining the neural network (w, b) and the pattern classes.
The neural network output was much less pretty. This, however, is easily explained. The classifier classifies on 4 variables: petal length, petal width, sepal length and sepal width. The graph, however, only plots petal length and width.
The k-means classifier also classifies on all 4 variables, but the neural network is just so much better that it weights the variables much more accurately.
To train the Neural Network, I started with initial weights of [.1, -.1, .1, .1] (semi-random) and an initial bias of -.7 (somewhere around the range for my best guess). The network ran for 100,000 iterations with a learning rate of .0001. the first three iterations are shown below.
As shown in the graphs above, the learning for a small step size still has noticeable changes early, but once the loop is almost done, the changes become barely noticeable. The learning works best for a low step size (I used .0001) and a large number of iterations (I used 10000). Once the graph runs through 100,000 iterations with a step size .0001, the MSE converges to 0.028491. The final graph is shown below:
If you'd like to see more, and even run the code, check out my GitHub page here!